
Don’t Let Your Perception Deceive You!
Most of the time, people tend to trust their perception about the markets. However, I’ve learned to never ask myself, “What do I think?” as it concerns the markets.
Instead, I trust measurable metrics such as fundamentals, technicals and sentiment. I like things that are defined and that I can put my finger on. Really, any good professional uses definable metrics. Aren’t you glad your pilot doesn’t just “go with his gut” when he’s flying you to your destination? Also, have you ever ridden with someone who acts like they know where they’re driving to and you know they’re lost but they won’t pull out a GPS? Using things that can be measured/defined help us to not have to go off of hunches, gut feels or anything that we perceive. I’ve found that those unmeasurable “feelings” will be way off base near market tops and bottoms.
But how do you know when the market is nearing a top? Well, there are metrics that we can use to gauge when we’re at risk of a top. For instance, we can track the historical average P/E (price-to-earnings ratio) of the S&P 500. Right now, that average P/E is at 25! In short, we’ve had market crashes once the price of the index got that far stretched from its average earnings.
Another way we can tell when we’re getting near a market top is by looking into Elliott Wave analysis. Elliott Wave Theory says the market goes up in five major waves (1-2-3-4-5) and corrects in three major waves (a-b-c). There are rules to each of these waves which I won’t go into here. But if you want to learn more about that, you can watch my video on the topic:
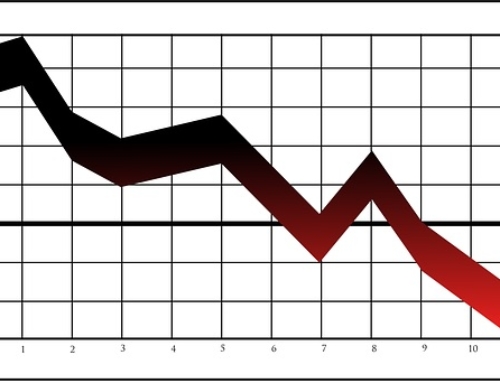
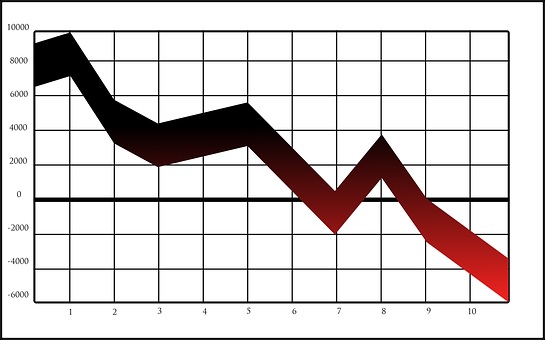
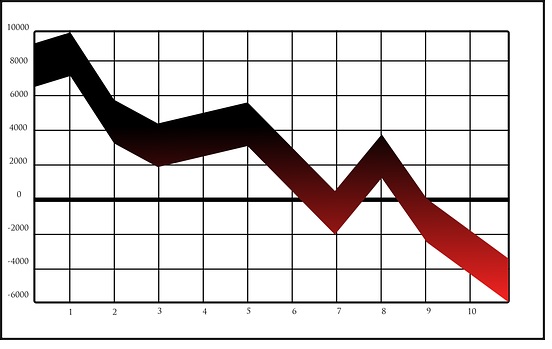
In the chart below, you’ll see I’ve labeled all five waves plus the end of wave C (which is the correction’s bottom). Notice that anytime we’re well into wave 5, we’re pressing our luck as far as upside gains and we’ve got HUGE downside risks.

Additionally, when wave 5 is nearing its end, we’ll see divergences typically form in the RSI or MACD indicators. This is where the indicator goes flat or slumps lower while the market is still rallying higher. It shows that the market is likely losing its upward momentum and that a change is likely coming, to the downside. I’ve emphasized those with the red slanted lines in the chart above.
Notice that the downturns were so harsh, percentage wise that even if you got out of the market a couple of years early before the market actually topped, that you’d have been glad you did because these declines in 1987, 2000, 2008, etc were at least 36% to around 60% corrections/crashes.
Yet had you exited early like that and seen the market continue to climb, your perception would be that you screwed up and that you “missed out”. However, ask anyone that rode the market all the way down (or most of the way down) and they would have loved to have switched places with your “early exit”.
I write all of this to you now because we’re well into wave 5 once again. We don’t know if we’re at the end yet BUT we do know that the risks are extremely high now due to the average P/E of 25, due to the market being well into wave 5, due to indicators diverging and due to the price of the index being so far stretched away/above its 200-week moving average.

Using these previous declines, percentage wise, as our guide we know that a decline on the S&P 500 down to the 1400-1800 area is highly likely. It doesn’t have to go that low but it’s very likely to trade into that boxed area.
Yet the perception right now in the market is that everything’s fine. The market is fine…after all, it’s gone up for a lot of years…one of the longest in our lifetime. Yet in reality, all that means is that it’s one of the most expensive markets in a long time.
They hear that unemployment is low (yet it’s always low before it starts to turn up again. So it ends up becoming a contrarian indicator, in actuality). And nobody is hardly losing their jobs yet and the news headlines are pretty rosy.So they’ve “perceived” that everything is “just fine” and there’s no danger lurking, however they couldn’t be more wrong.
Fundamentals, technicals and sentiment all tell us that they’re treading on thin ice and they don’t realize it. In fact, with this bull market going as long as it has, even some of my own subscribers will be tempted to want to be in the broader market at this time.
But just know, right now, it’s more important than ever to rely on measurable metrics and not what you think about the market. What you think has to do with what “has happened” and it leads you to think that it will continue to happen. However, to be a successful investor, long-term, you’ve got to learn when the risks are high and be out during those times and learn when the risks are becoming lower again and step back into the market during those times (using my averaging down technique).
So…don’t be fooled. Right now, it’s more important than ever to think like a pro and assess these high risks and to dodge them.
No one can call a top or a bottom. BUT anyone can learn how to assess when the risks are high or low and when conditions are ripe for a topping or bottoming and act accordingly.
God bless!


Leave A Comment
You must be logged in to post a comment.