
Here’s a sample of what one of my monthly newsletters looks like. Only $23.97 per month! No contract. Cancel online any time. Subscribers get monthly newsletters, buy/sell recommendations, and weekly videos that go over our stock positions.
Sample
The Logical Investor Newsletter: January 2020
We’re living in uncertain times: Coronavirus…impeachment hearings…election uncertainty…who runs against Trump on the Democrat side?…the economy isn’t doing so hot, yet the stock market has done well, etc.
You hear about all of these variables all the time in the financial media. However, thankfully, we don’t have to know how ANY of those things turn out to win with our stocks. See, most people make it too difficult. They analyze everything but the actual company, to find out what the actual stock should do over time.
I learned a long time ago (from Warren Buffett) that I don’t have to know what the economy is going to do or who gets elected or what the S&P 500 ends the year at, etc. in order to be nicely profitable in stocks. Why? It’s because we do what he does. We analyze the actual company to see what we believe will happen with the actual stock price. We go directly to the source and we cut out all the other fluff.
You see, we can’t quantify ahead of time and know how bad that virus gets or, for certain, the election outcome etc. Those aren’t fully measurable. It’s why we stick to what matters. Market cap is measurable. So are price-to-earnings ratios. Cash is measurable. Earnings are measurable. Debt is measurable. Historical P/E’s are measurable. A stock’s P/E relative to the overall market is measurable. These types of things are the only things we have to know in order to be successful over time. In other words…is the company strong or not? If it’s not, we pass and go on to another company that is. After all, why invest our hard-earned money into a company with weak fundamentals when we can invest in one with strong fundamentals.
And then…if the stock is fundamentally strong, is it also fundamentally cheap? Both boxes have to be checked in order for us to invest. Then, and only then, will we go on to technical analysis aka charting and sentiment analysis (found in the volume part of the chart and through knowing what stage of the uptrend or downtrend we’re in via Elliott Wave counts).
This type of analysis is always crucial…but never more crucial than the times we’re living in now, with nosebleed valuations in other overall stock market. For instance, just from a fundamental perspective…look at the average P/E’s of all of these indexes below. Any way you slice it, the overall market is expensive and risky!

Another way we can view it is graphically on a chart. Look at the average P/E for the S&P 500, since the 1800’s. We’re at a trailing P/E of almost 25! That’s higher than the stock market crash of 1929…higher than the crash of 1987 and in 2000 and 2008 the earnings collapsed even faster than stock prices were collapsing, making really an inaccurate picture of those P/E’s. However, you can see that we’re starting into the dangerous territory that they were in before and during their crashes. So, to say that the market is on thin ice is almost an understatement.
I know…it doesn’t “feel” risky. But it’s like the guy that walks across the tightrope and doesn’t happen to fall off that time. The risks were still there. And that’s where we are in the market right now. The risks are HUGE for those invested in the overall stock market via mutual funds, most ETFs and most stocks that have tracked the market and that have similar valuations to the overall market. The problem with how most people determine risks are that they only realize them once they are felt. And once they’re felt…it’s too late. Stocks are sliding and accounts are bleeding and it blindsided them because they failed to use measurable metrics. Instead, they just invested because “the market was going up”. That’s their whole reason for investing…and their analysis stops there.
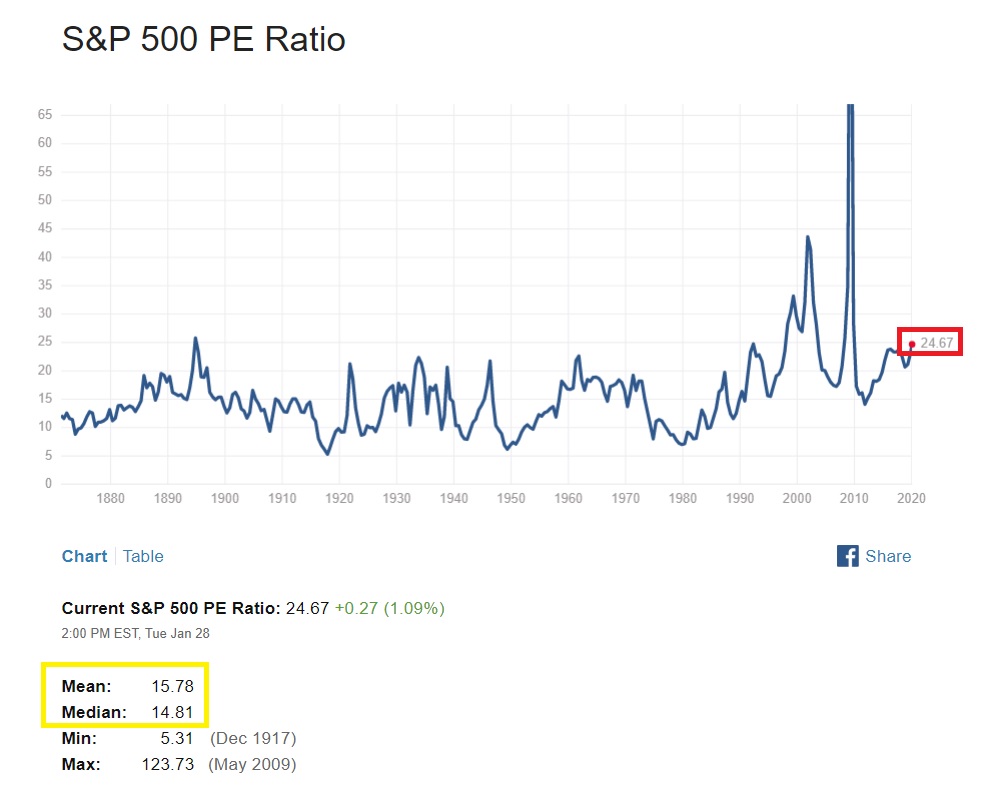
Notice, over time what a “fair value” P/E is for the S&P 500 (in the yellow boxed area on the chart above). Anywhere in the 14’s to 15’s is where the market is more fairly valued. Well, right now, we’re getting closer to double those valuations!!! And that’s not good for the overall market. Does it mean the market has to head lower tomorrow because of all of this? No. In fact, overvaluation just shows the risk but not “when” the bubble pops. No one knows “when” it will happen or “what” event will pop the bubble. But thankfully, we don’t have to know any of the latter…we only have to know when risks are high and then avoid the broader market during those times. And we use any downdrafts in the market to gain an edge to buy solid, cheap stocks even cheaper by averaging down. To the TRUE value investor…downtrends are the investor’s friend, not enemy.
Also, in order for the overall market to be a value, the average P/E would have to be lower than the average, like a P/E of 8, 10 or maybe 12. It will take a massive correction of stock prices to get the price (P) back down to that ratio with the earnings (E).
Then…on the technical side of things, we continue to see warning signs as well. For instance, look at how far away the price of the S&P 500 is away from its 200-week moving average. This is one of the biggest “visuals” of risk you’ll ever see. They’re huge “tip-offs” to risks of a downturn to come (well ahead of time). In fact, the width between the price and the moving average are possibly even higher now (more stretched) than they were in the crashes of 2000 and 2008! Additionally, look at how grossly overbought the RSI is on this long-term weekly chart. Yet another warning sign of how overdone this market has become.

Remember how markets work. Don’t be fooled. There are sentiment stages (ways of thinking) associated with each phase of a market rally and also the following bear market. Here’s a chart as a reminder. We’re in that phase of greed, delusion and a “new paradigm” (a false believe that since most people are buying regularly into index funds, that it will always push their stocks higher. Nothing could be further from the truth. Index fund redemptions/sells can take it away as fast or faster than it ever pushed stocks higher).
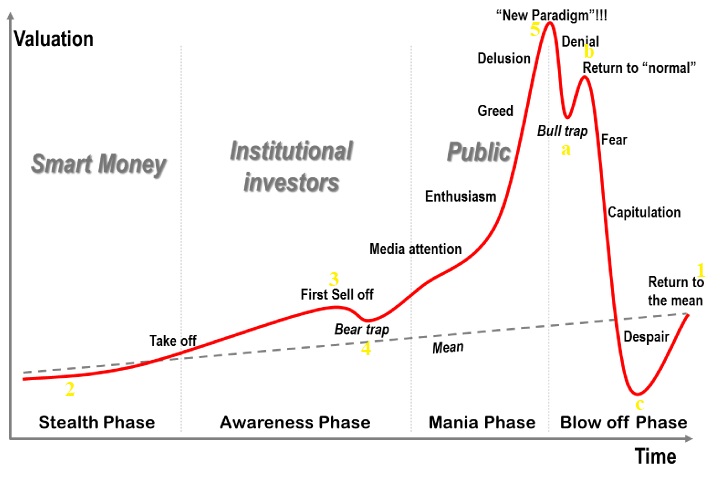
You’ll hear people wrongly say, “Well, I’ll know when we’re at the top and I’ll just sell”. However, that’s ignorance on fire! It doesn’t work that way. As you can see from above, they get sucked into a denial that a downtrend can even happen and they get sucked into a “bull trap” as they’ve been conditioned to “buy every dip”. Yet by the time they realize this “dip” doesn’t go to higher highs but yet even lower lows…that’s when they realize “it’s changed”. And by the time that’s happened, they’re so far underwater that either they’ll sell out at a great loss or they’ll ride it toward the bottom and sell out of emotional pain or ride it all the way down and back up (which at times has taken 10-14 years!)
The notion to “always stay invested” and “it will always come back” is stupid! There’s no reason to stay in something overpriced and while yes, something may eventually come back to today’s levels…it could be a decade or more later. So, how old would that make us and would some even be around to see it? So, it’s a stupid notion for any real investor. Staying fully invested is to the advantage of your broker, not you. Why? You’re less apt to cash out and take your money elsewhere if you remain fully invested. And the two goals of a brokerage firm are: 1) Get assets in, and 2) retain those assets. So, teaching you to always remain fully invested helps them to meet those two goals.
Instead, when stocks are in waves C or 2, sentiment is horrible. “Nobody” wants the stock and “everybody” thinks you’re an idiot for buying it. That’s when the true values (for solid companies, fundamentally) present themselves. If people thought highly of the stock at the time, the price would reflect it. You have to get the stock when people are highly emotional/fearful and have misjudged the company based off of stupid notions that are flying around the financial media universe and ill-advised headlines seen on the internet.
Okay, now let’s move on to this month’s pick! Cardinal Health, Inc. (CAH)
Why Cardinal Health? Well, it’s a $15.6 billion company (that’s been around since 1979) and that’s gotten out of favor with investors over the past four years in a row. Over that time, it’s cut in half in price at its recent lower levels, yet is showing some signs of life again (which we’ll talk about in the charts below in just a bit).
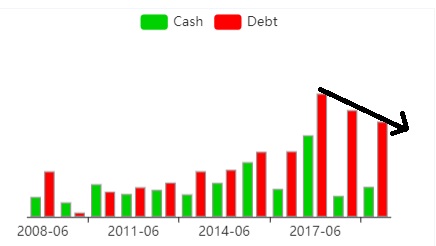
I also like the fact that they earned $2.86 billion last year and that they’ve got $1.21 billion in cash (which they can cover their 3.58% dividend yield with! The next dividend will come around the end of March, if they do as they’ve always done.)
They’ve got $8.41 billion in debt but that’s still at healthy levels, especially considering that the stock price (and therefore market cap) are both suppressed right now. Also, that debt has been steadily coming down over the past few years, which is encouraging!
But by all of these fundamental metrics mentioned above, we know that the company is solid, fundamentally. Next, we look to see if it’s cheap fundamentally as well.
I like it that it’s got a trailing price-to-earnings ratio (P/E) of 11.86 and a forward P/E of 10.20. So, the stock is fundamentally cheap. In fact, we can see how the P/E has cheapened over the last few years by seeing it graphically displayed on the chart below. (I love visuals!)

Remember: The overall market has an average P/E of around 25-26. Yet our stock has a P/E in the 10’s! In fact, it’s P/E is far cheaper than its sector as well. See the chart below. The typical medical stock is over twice the P/E of our stock!

Read more about Cardinal Health and what they do, here: https://finance.yahoo.com/quote/CAH/profile?p=CAH
Okay, so we’ve checked off the boxes of being fundamentally sound and fundamentally cheap, while at the same time being hated by the market (as the stock has declined for the past four years in a row). So, since these first/crucial boxes have been checked, then we can move on to the technicals and sentiment surrounding the stock.
In looking at a really long chart, going back almost 30 years, we can see that the stock last peaked around $80 per share (end of wave 5) as the calendar was rolling over to 2016. Since then, for just over four years now, the stock has been in an a-b-c downtrend/decline. I’ve been sitting on my hands all this time waiting for some technical “signs of life” to show up on the chart that could indicate that the worst of the downtrend is behind and that an uptrend could be beginning. With this said, because of how we allocate money, I’ll have averaging down points strategically placed along long-term support zones that I see on the charts. So, we’re perfectly fine if the stock declines MUCH further from where we’ll enter, in order to get all rounds of investment in.
Well, on this chart, I started seeing its first sustainable “signs of life”/turnaround. First of all, I can see that the stock bounced off of a strong area of support (and former resistance) of around $40 per share, as the RSI and MACD were both improving and while the price had broken above one corrective (red) line.

By zooming in more on the chart below (by looking at the last two decades), we can see things even more clearly. As you can see from the yellow lines below, I see a few likely scenarios playing out. So that’s what’s going to determine our entry LIMIT order and our two averaging down levels that I’ll mention just a bit later.
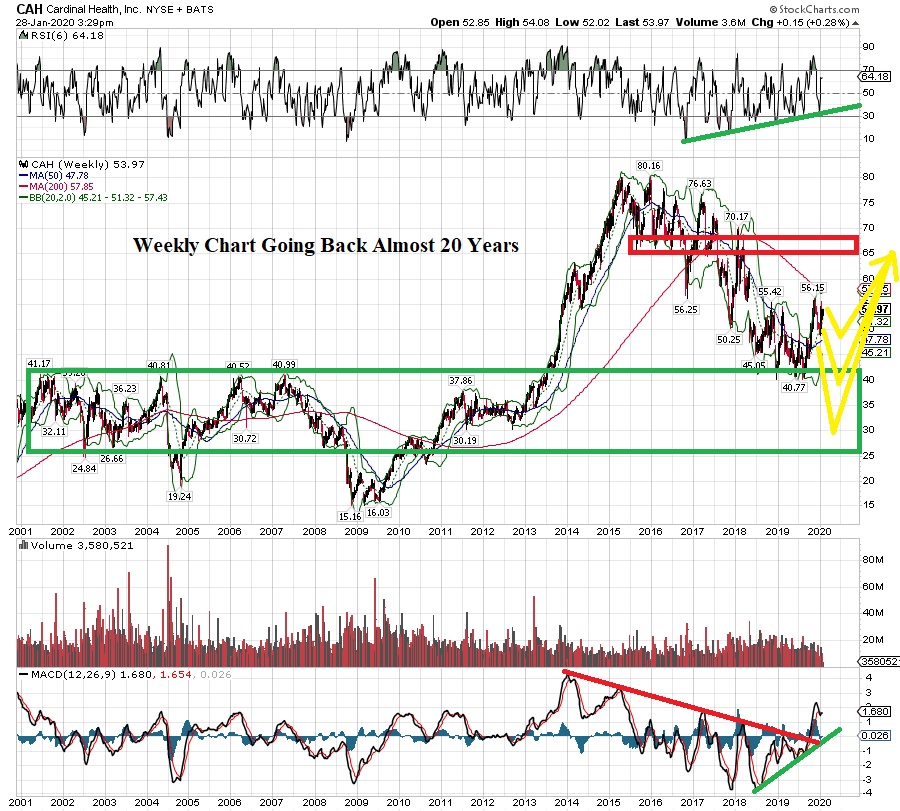
I believe that the stock should have no problem eventually making it up to the $65-$66 region and that would give us a good return even if we only got ONE round of investment in. However, if we can get a 2nd or 3rd round of investment in, that return will be turbo-charged!
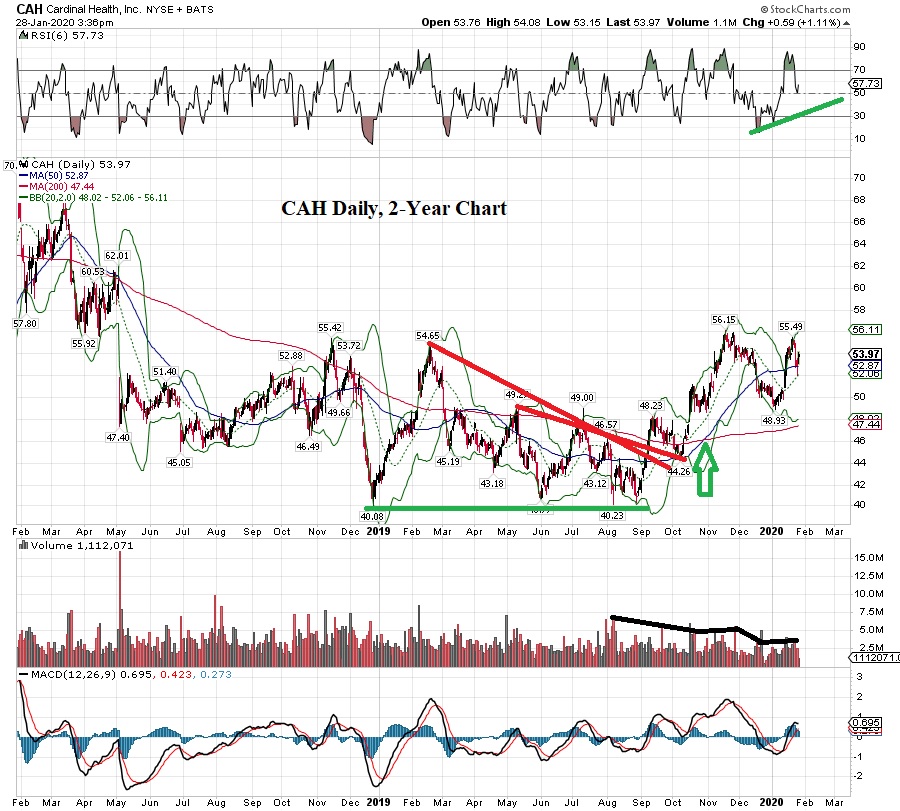
While we don’t know for sure yet if wave C’s decline is over or still has more to go, I am seeing some technical improvements on the daily, 2-year chart below that are promising. So, with the stock being fundamentally cheap and improving technically, it’s about time to tip our toe into the water.
On this daily chart below, I’m seeing the stock potentially “double bottom” around the $40ish area as the calendar was turning over into 2019 and again (for the 2nd leg of the double bottom) in the following August. Now, it’s broken above red corrective lines (either way you choose to draw them) and it’s climbed above its 50- and 200-day moving averages, while also forming a golden cross (upward green arrow emphasizes this).
Additionally, the RSI and MACD are improving overall and both moving averages are trending higher while the selling volume is dying off. A sight I love to see!
Therefore, I believe it’s time to enter this stock AS LONG AS it pulls back a bit more to the $51.50 level or lower. So, here’s the recommendation.
Recommendation: Buy Cardinal Health (CAH) at a BUY LIMIT order of $51.50 Good-Til-Canceled.
Note: That’s below its present price. So, this is not a market order recommendation. You can buy at a limit of $51.50 or you can use a market order if you see the stock at the recommended price or lower. (Contact your broker with any questions about how to place a buy limit order GTC).
Averaging down points will be at $42 and $32 per share. I believe it’s got the potential to rise to the $65-$66ish area, ultimately.
Also note that with a limit order…if the market continued to rally and never pulled back to the $51.50 area, we could potentially miss out on this one. But I feel it’s vital to get in at a price that I feel good about, given my price target for it. So it’s better to be patient and be disciplined here, even though there is a slight risk of missing the move.
God bless!


One subscriber gave us a look at the growth of his portfolio after following the picks in the newsletter. Awesome!
Sooo interesting and accurate!
All makes sense
This newsletter is from January it’s this still relevant?
During this Market Sept
Cardinal health has been down
You were right if someone invested in January then sold after hold it will be good return I know Cardinal H went up last time. But I didn’t know it and I pass it on. Now it’s declined
Yes indeed Money does solve problems.